Oil & Gas · Saskatchewan
Hundreds per report, down to minutes
A data-acquisition company paid hundreds per report to manually format gauge CSVs into PDF pressure surveys. We built a browser tool that does it in minutes.
The problem
A pressure-data-acquisition company drops gauges into oil wells across Saskatchewan. Those gauges record pressure and temperature over days or weeks and output CSV files with thousands of data points. Every well needs a professional multi-page PDF pressure survey report.
The company was paying hundreds of dollars per report to have someone manually format those CSVs into industry-standard documents. Same formatting job, different data, every single time. A recurring cost on every well with no end in sight.
What we built
A custom report-generation tool that runs entirely in the browser. No server, no subscription, no login, no internet required after the first load. One self-contained application.
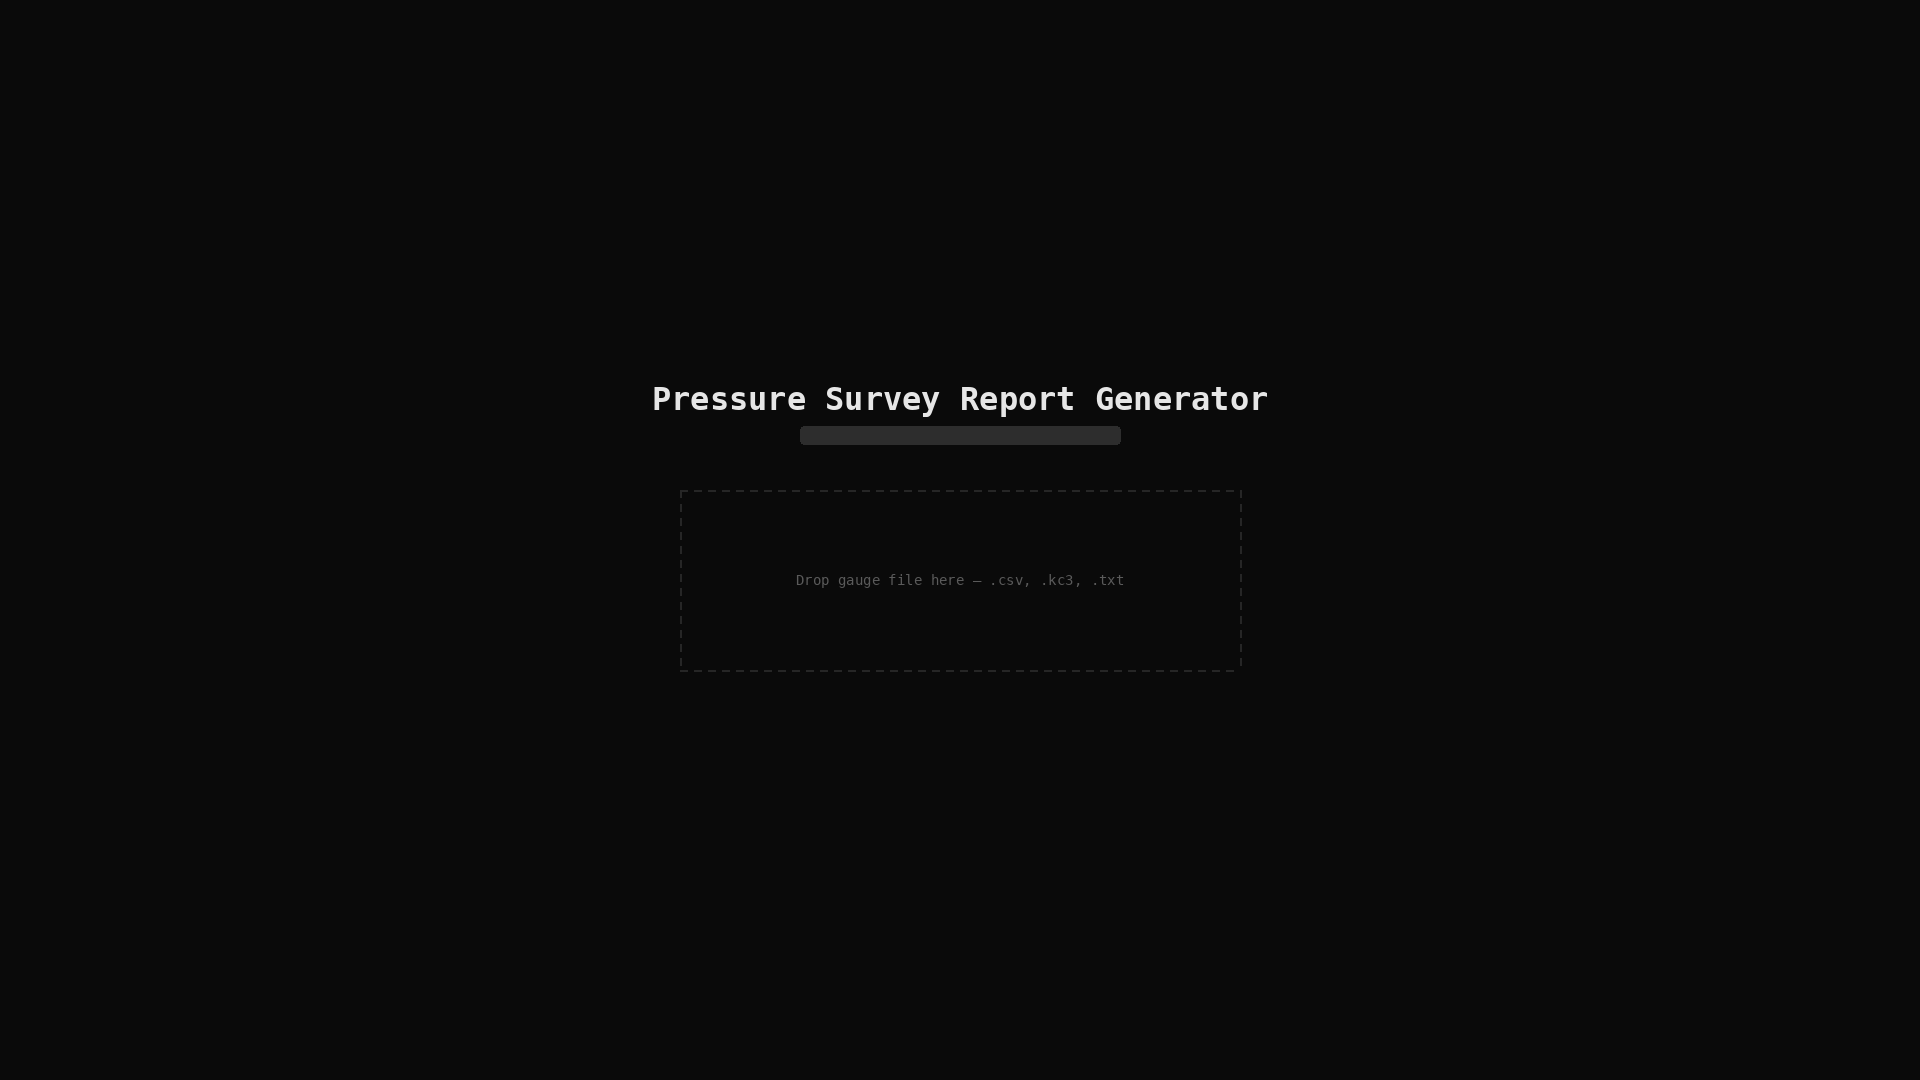
Step 1: Upload
The user opens the tool in their browser and drags in the raw gauge CSV file. The tool auto-parses the data — gauge serial number, calibration date, range, test start and end times, total elapsed duration. All pulled directly from the file.
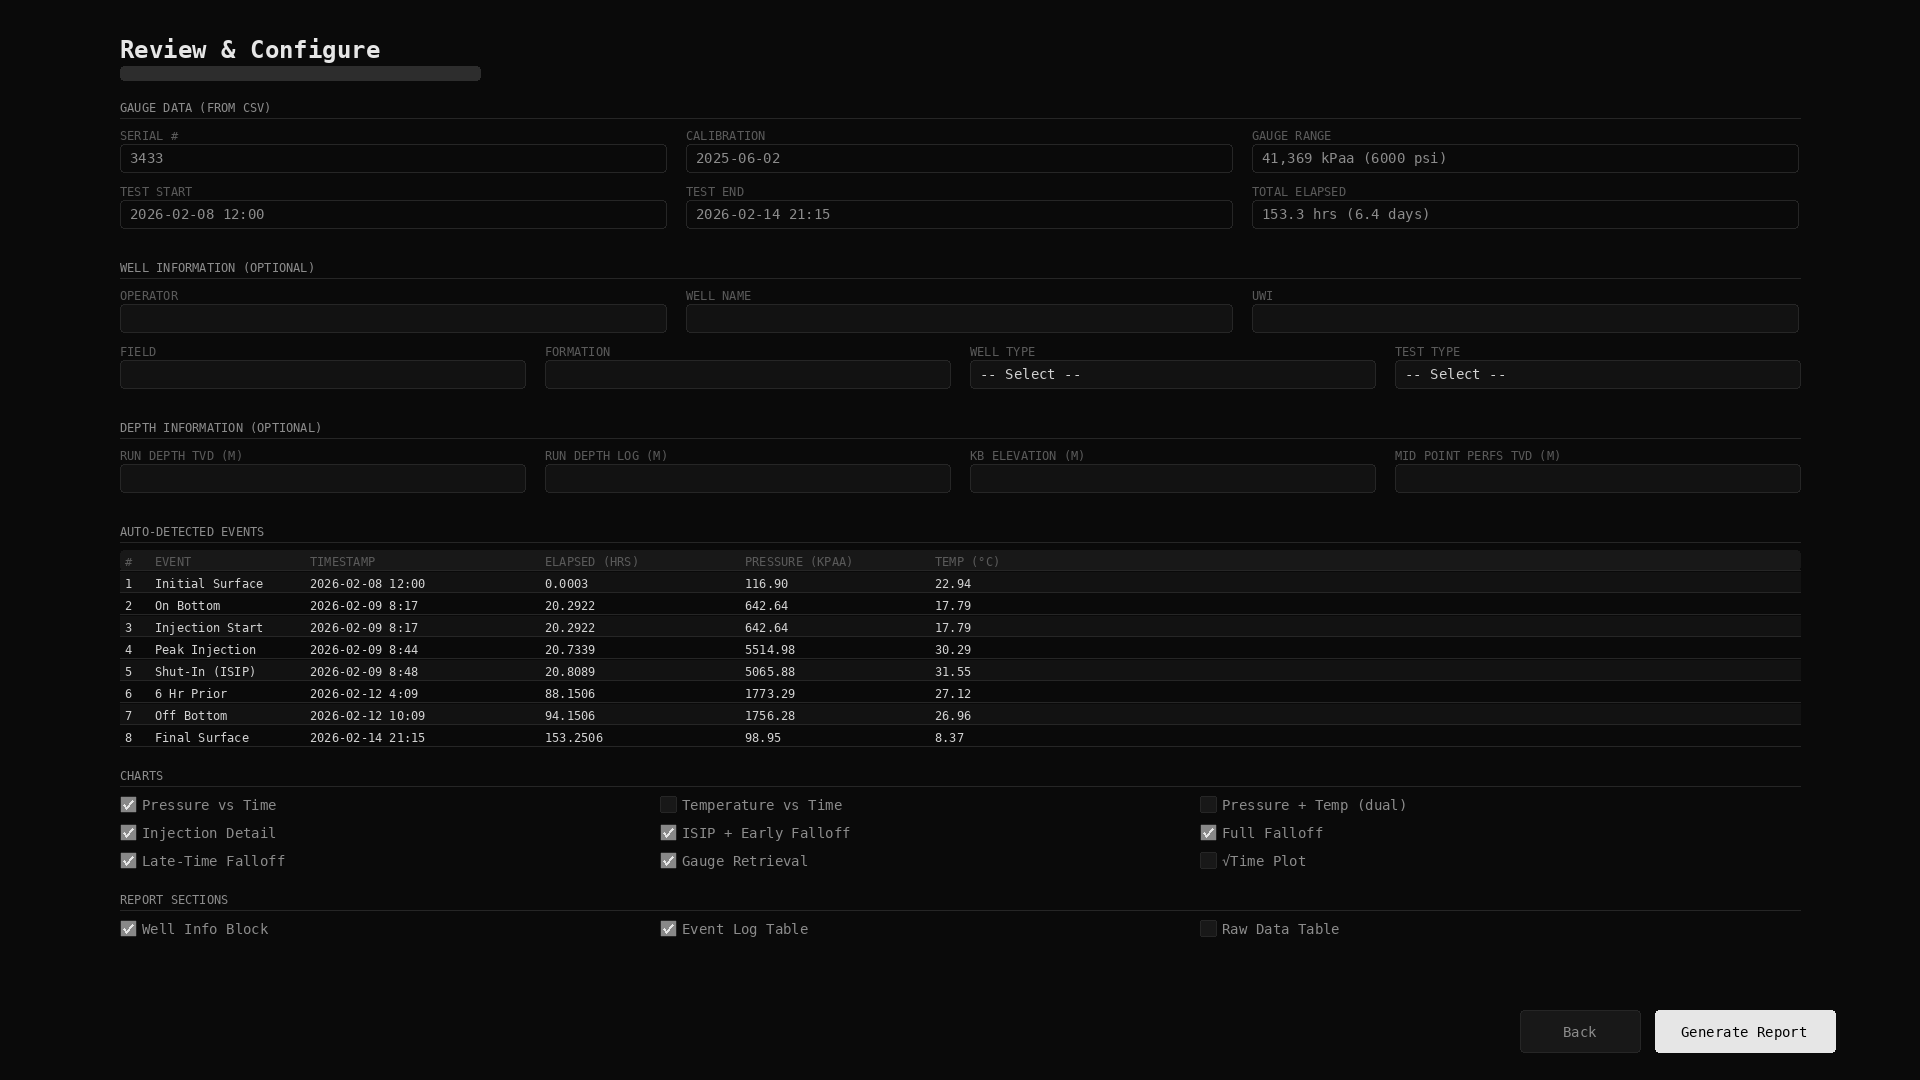
Step 2: Configure
The tool auto-detects key pressure events from the raw data — initial surface readings, on-bottom, injection start, peak injection, shut-in (ISIP), falloff markers, off-bottom, and final surface. Each event is timestamped with elapsed hours, pressure in kPaa, and temperature.
The user fills in well information — operator, well name, formation, test type — and the tool supports every standard test type, not just one. It handles single or dual gauge data automatically. They select which charts to include — pressure vs time, temperature vs time, injection detail, ISIP and early falloff, full falloff, late-time falloff, gauge retrieval, and more.
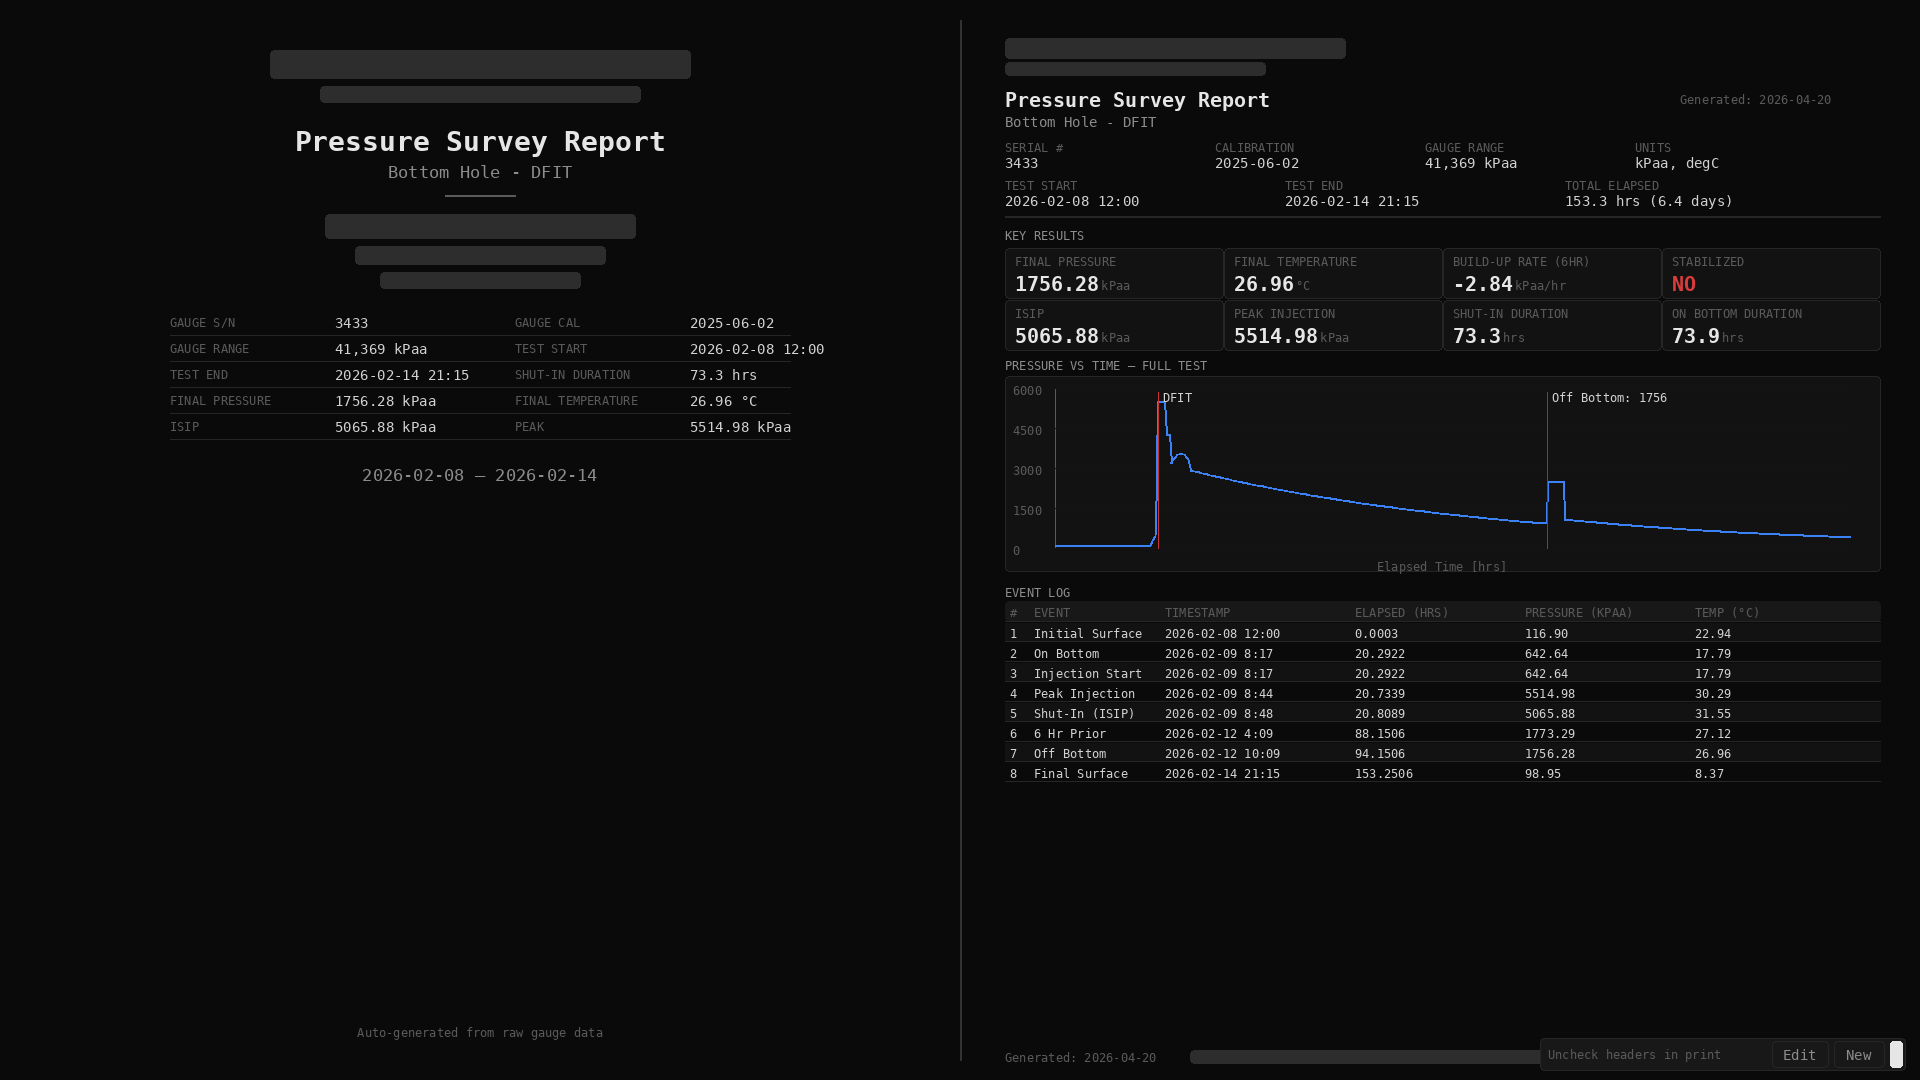
Step 3: Generate
The user creates as many chart views as they need, each with its own axis ranges and zoom levels, with interactive preview including scroll-to-zoom and drag-to-pan. Then they export a single multi-page PDF that matches industry standard format — cover page, well information, perforations, data tables, and chart pages with properly labelled axes, annotations marking key pressure events and calculated values, and legends where needed.
We also verified the accuracy of the company's existing manual reports, cross-referencing the raw CSV data against reported values — peak injection pressure, shut-in pressure, build-up rates, elapsed times — and confirmed exact matches across every key measurement.
The outcome
A recurring cost, eliminated. What used to take manual formatting work and hundreds of dollars per report now takes minutes, with the same professional, industry-standard output — and the user controls every aspect of it. No ongoing subscription, no vendor dependency. One tool, unlimited reports.
Want to see what your new website could look like?
Paste your URL and we'll rebuild your site for free. You see the result before you pay anything.